Lookthrough table
A table whose rows open into the records beneath them, level by level, with its own columns and KPIs at each depth.
A lookthrough is a table that opens. A row of funds opens into its sub-funds, one of those into its positions, and a position into the instrument behind it. Each level is a table in its own right, with its own columns, conditions, ordering and paging.
It answers the question a flat table cannot: not what are my positions, but what is inside this fund, and what is inside that.
Add one
A lookthrough is a table that opens its rows rather than a separate kind of widget, so it has no entry of its own in the add menu.
- Add a Table widget to the canvas.
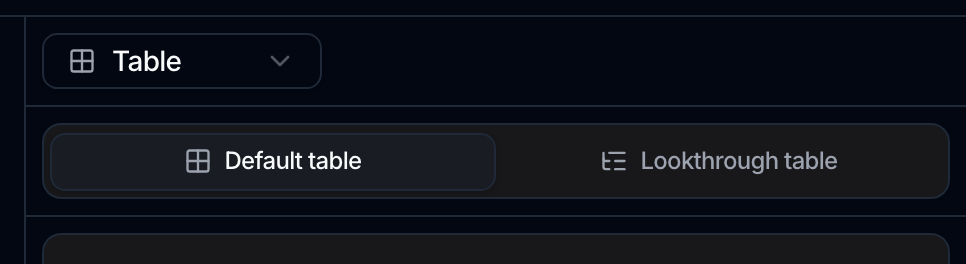
- At the top of its panel, switch from Default table to Lookthrough table.
The panel changes to a Hierarchy builder. The two stay separate underneath, so switching back and forth while you are still deciding is fine, but each keeps its own configuration.
Build the hierarchy
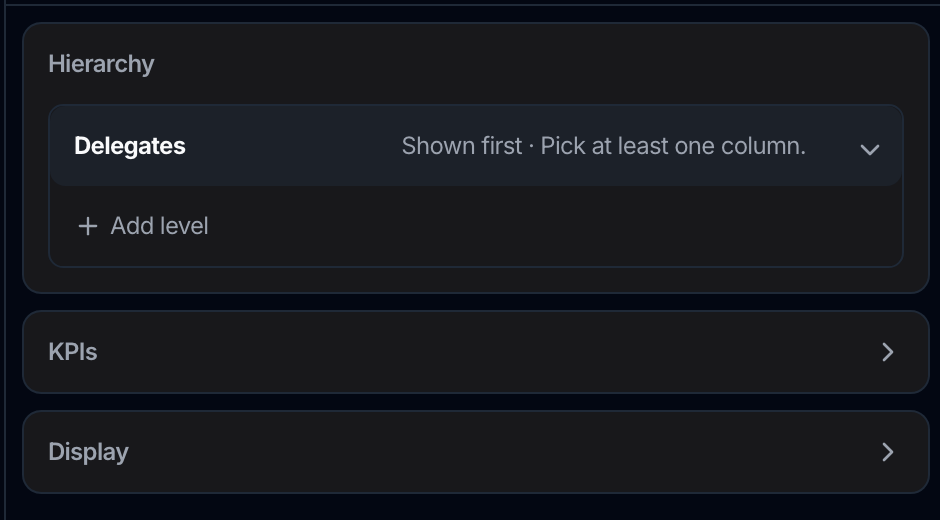
The first level is the data the widget shows, the one everything else hangs off. Pick its object, then use Add level for each level that opens beneath it.
Each level carries its own settings:
| Setting | What it does |
|---|---|
| Heading | What this level is called in the widget |
| Columns | The columns this level shows. At least one is required |
| Only rows where | Conditions scoping this level, the same builder used on data views |
| Sort by | The order its rows appear in |
| Rows per page | How many rows it shows before it pages |
What can hang off what
A level opens beneath its parent by following a relationship, and the direction matters. The relationship has to live on the child, pointing up at the parent: a position names its sub-fund, so positions can hang off sub-funds.
In practice that means:
- Many to one is the ordinary case. Many positions point at one sub-fund.
- One to one works too, and at most one row opens.
- Many to many cannot carry a level, and the picker leaves those relationships out rather than offering one that would not work.
Configuring a level never creates a relationship, it only uses one that already exists. If the link you want is not offered, add it on the object first. See Attribute types.
Branches
Two levels sharing the same parent become two sections under each parent row, each with its own conditions. That is how an investment product's equity holdings and its option holdings are shown separately: same parent, same relationship, different conditions.
A branch that matches nothing for a given row renders nothing, so rows are not padded with empty sections.
Add KPIs
Any level can carry KPIs: a sum, a count or an average over that level's records, shown with the level rather than at the top of the widget.
A KPI counts across every row of that level, not just the ones on the page you are looking at. The widget says so where the numbers appear, because the alternative reading, a total of the page, would be wrong in a way nobody would notice.
Reading one
Click a row to open it. The level beneath appears under that row, with its own heading, its own columns and its own pager.
- Open full width gives a level the whole card when its columns are cramped, and Back to the hierarchy returns.
- Each level pages independently, so opening a fund three pages deep does not reset anything above it.
- Rows that point at nothing above them are grouped as Unmatched, with the explanation These rows point at nothing above them, so they appear under no row. That group is usually the most interesting thing on screen: it is your orphan data, made visible rather than silently dropped.
Fix where a row belongs
Because the hierarchy makes orphans and misfilings obvious, you can correct them in place. On any row of a level that has a parent, open its actions:
- Change parent opens a picker to move the row under a different parent record.
- Decouple detaches it from its parent, which sends it to Unmatched.
Neither writes straight away. Changes are staged, marked Moved, not saved yet on the row, so you can correct several rows and commit them together. The table underneath keeps showing what is actually saved until you do.
Reparenting edits the underlying records, so it follows your permissions on the object, not your access to the canvas. If you are not allowed to change that data, Spark says You cannot change this data rather than staging an edit that would fail on save.
Export
A lookthrough exports to CSV from its menu, like the other data widgets. See Build a canvas.