KPI
Reduce a data source to a single headline number.
A KPI widget shows one number, the result of aggregating a data source. It's the right widget for a headline figure: a total, a count, an average. For the shared editor mechanics, see Build a canvas.
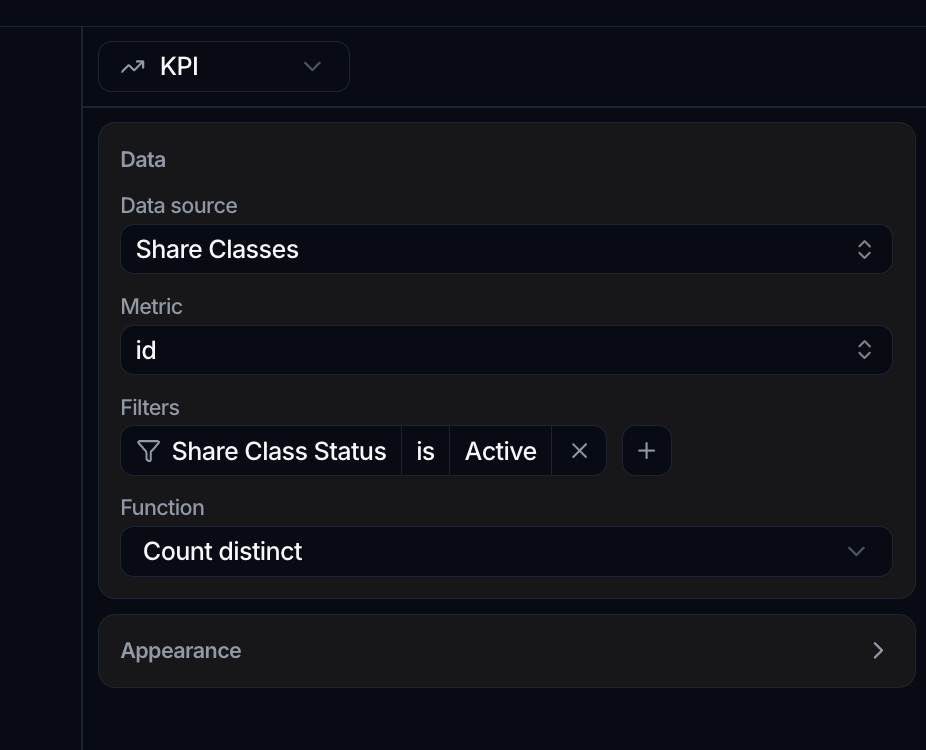
Set the number
In the Data panel:
- Set the Data source to the object the KPI reads from.
- Set the Metric to the attribute the number is based on. The metric can reach across a relationship to an attribute on a linked object.
- Pick a Function to compute it: Count, Count distinct, Sum, Avg, Min or Max (choose None to leave it unaggregated). The numeric functions require a numeric metric.
- Use Filters in the same panel to scope which records feed the number.
The KPI then displays the metric aggregated by the function across every record that passes the filters.
How the number is formatted
A KPI formats its value with the metric attribute's own display configuration: format, decimal places, separators, and any prefix, suffix or multiplier. Set it on the attribute in Data and the KPI follows. See Format how a number displays.
A metric with no display configuration falls back to a shortened form, which suits a headline count. Configure the attribute when the exact figure matters, for example a rate that needs four decimals.
Appearance
The Appearance panel has one setting, KPI Color, which tints the widget.
Export
Hover the KPI to reveal its ⋮ menu. You can Export Chart (the single value as a CSV), Export Data (the underlying records as a CSV), or Export card (the KPI as a PNG). KPI widgets don't have an expand view.
A KPI has no built-in comparison or trend indicator. To show a change over time, pair a KPI with a chart on the same canvas, or scope two KPIs to different periods with filters.