Table
Show records in a grid, with optional inline editing, column totals, transpose and record squashing.
A table widget shows records from a data object as a grid on the canvas. It's the most capable widget: pick columns, total them, let viewers edit inline, transpose it, and merge records. For the shared editor mechanics, see Build a canvas.
Two kinds of table
At the top of the table's panel, a pair of tabs chooses what kind of table this is:
- Default table, a flat grid of records, which is what the rest of this page describes.
- Lookthrough table, whose rows open into the records beneath them, level by level. See Lookthrough.
A lookthrough is a table that opens its rows rather than a separate widget, which is why it is reached by adding a table and switching rather than from the add menu. The two keep their own configuration, so switching back and forth while you decide costs you nothing.
Choose the data and columns
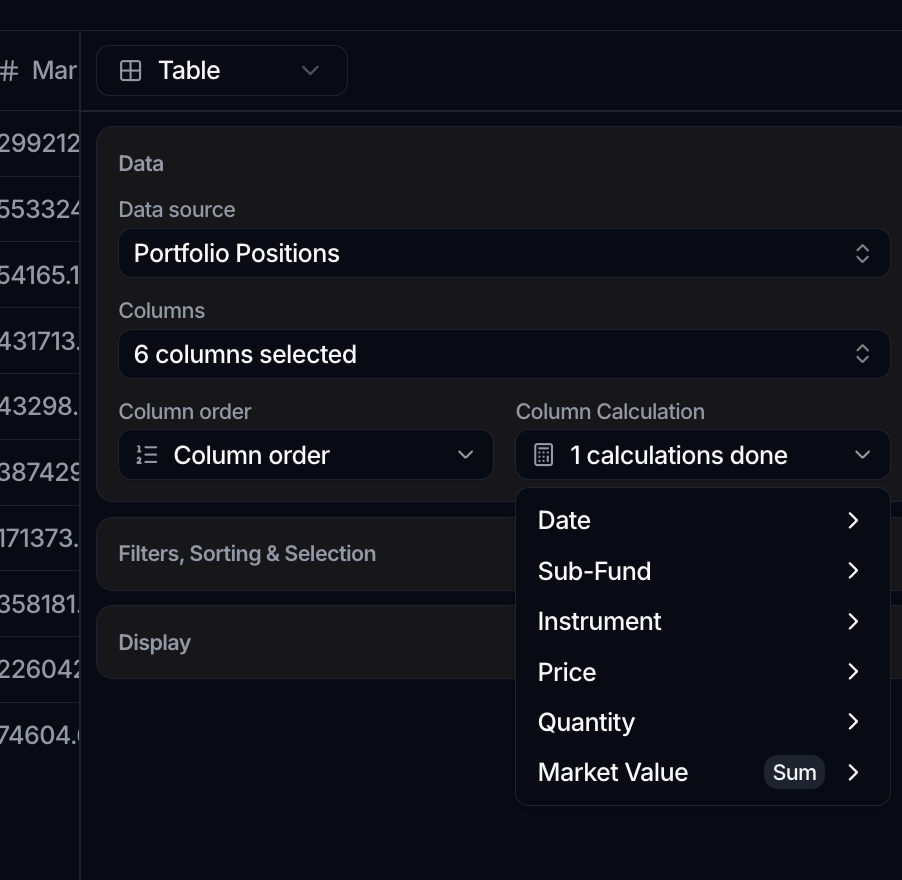
The Data panel has:
- Data source: the object the table reads from.
- Columns: the attributes to show. The picker is the same one used on data views, so you can reach across a relationship to show an attribute from a linked object as a column. See Manage data views.
- Column order: drag the selected columns into the order you want.
- Column Calculation: add a per-column total shown under the table. Each column offers the aggregations that fit its type: Sum, Average, Max, Min, Count Filled, Count Empty and Count Distinct.
Filter, sort and allow editing
The Filters, Sorting & Selection panel has the usual Filters and Sort by builder, plus a Record editing switch.
Turn Record editing on to let viewers select and edit records straight from the canvas in view mode. This adds row selection and inline editing to the widget. Leave it off (the default) and the table is read-only.
Sort from a column header while viewing
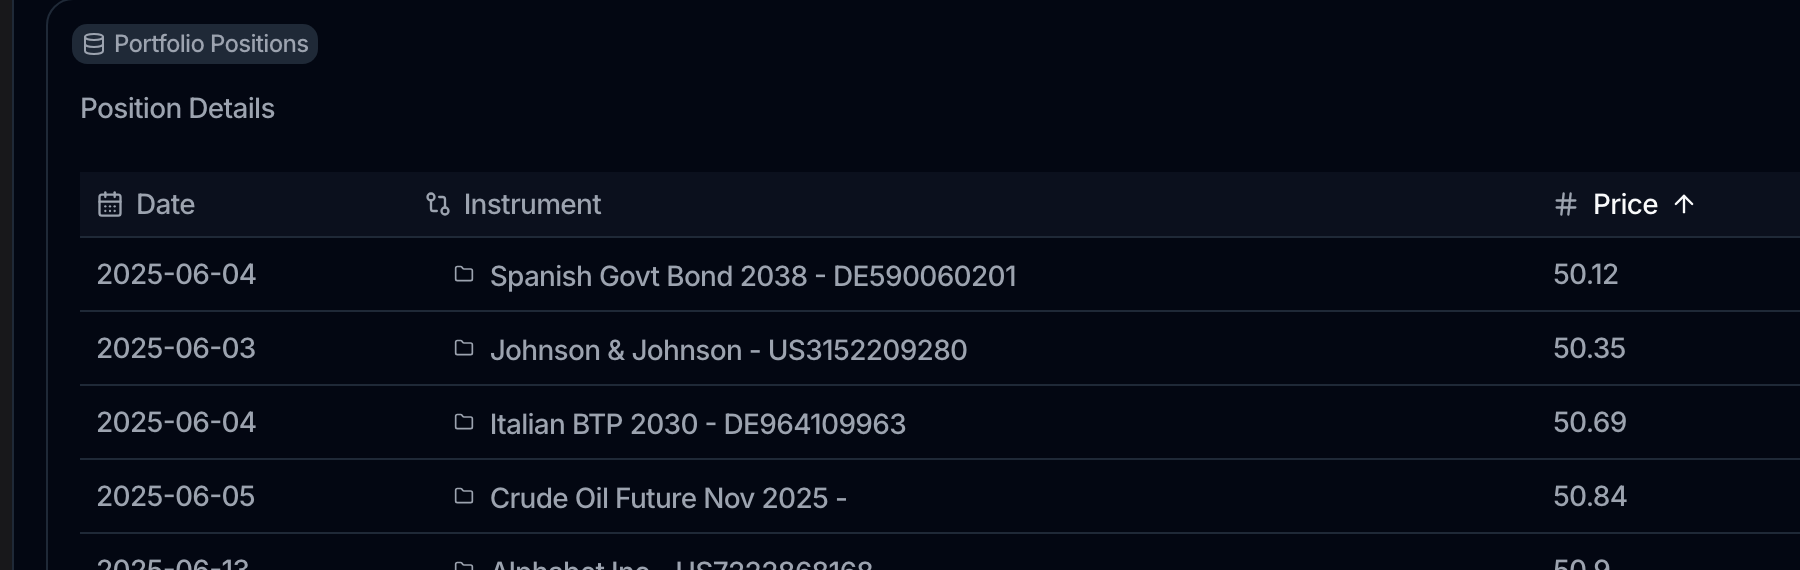
Viewers can reorder a table without editing the canvas. While viewing a canvas, click a table widget's column header to sort by it, and click again to cycle through ascending, descending and back to the widget's own order. The table returns to its first page, since re-sorting reshuffles the whole record set.
This is a shortcut for reading, and it lasts only for your session: it does not touch the widget's saved sort and nobody else sees it. To change the sort the widget actually stores, edit the canvas and use Sort by in the panel, or the column menu in edit mode.
Let the table size itself
The Display panel has an Auto-fit height of canvas switch. Turn it on and the card takes the height its rows need rather than the grid rows you drew, up to a ceiling past which it scrolls. Useful for a table whose row count changes over time. See Build a canvas.
Transpose
The Display panel has a Transpose switch. Transposing swaps rows and columns, so each attribute becomes a row and each record becomes a column, which reads well for a handful of records shown side by side. A transposed table is read-only: Record editing and Column Calculation are disabled while it's on.
Squash and unsquash records
When Record editing is on, viewers can merge and split records directly from the table in view mode.
- Squash appears once two or more records are selected. It merges the selected records into one; the originals are deleted. A confirmation dialog previews, per attribute, the Resulting value and any Lost values, and asks you to acknowledge that some values will be lost before you confirm. Formula attributes are recalculated afterward. This can't be undone.
- Unsquash appears when exactly one record is selected. It splits that record into two, with arrows to move multi-value items between the two child records.
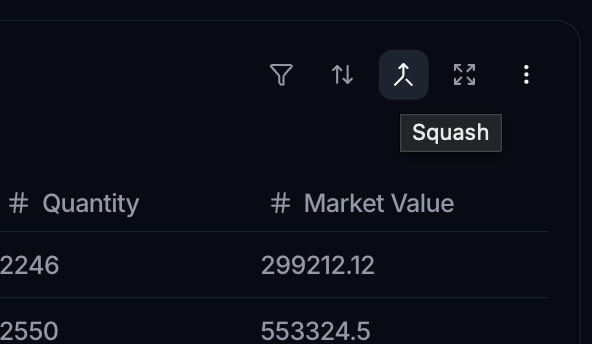
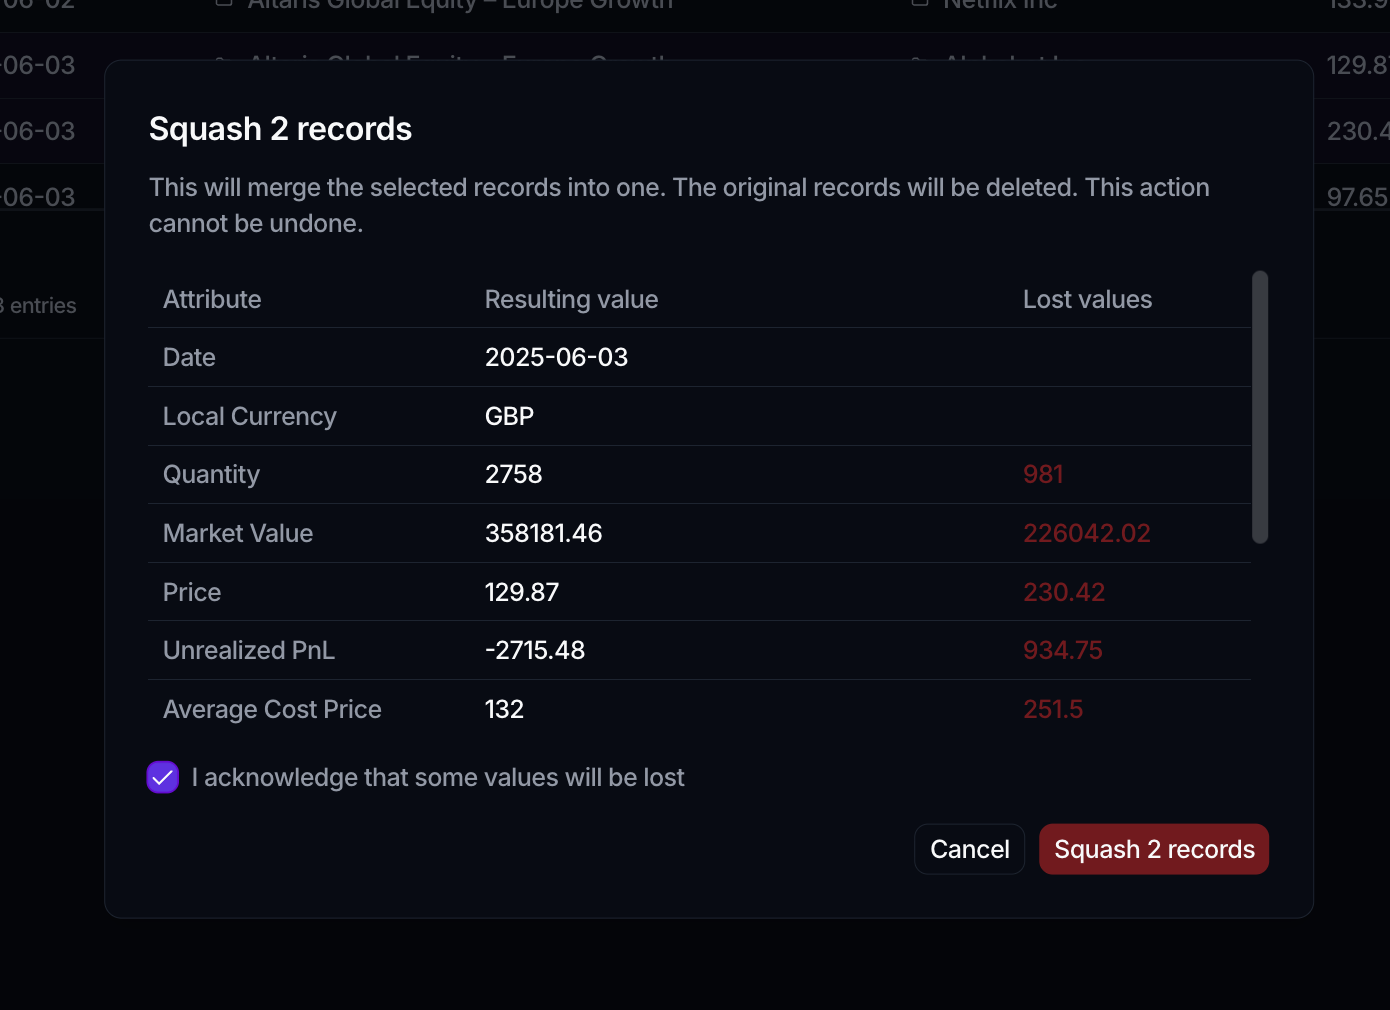
Squashing permanently deletes the records it merges, so it's best used to deduplicate. Review the Lost values column in the dialog before confirming.
Paging through records
The table pages its rows. The Rows per page selector (10, 25, 50 or 100) is available in edit mode, and the footer shows the range and page count. When you Expand the table from its menu, the expanded view pages through 25 rows at a time independently of the card.
Export
From the table's ⋮ menu you can Export Chart (the displayed rows as a CSV) or Export card (the table as a PNG), and Expand it to a large modal. See Build a canvas.