Monitoring
Track how your agents are used: calls, tokens, models, tools and skills.
Spark's Monitoring area, under Settings, is where you keep an eye on usage across the workspace. It has three views: Agent Usage, Data Usage, and Workflow Usage. This page focuses on Agent Usage, the dashboard for how much your agents are being used and what they are doing.
Open the Agent Usage page
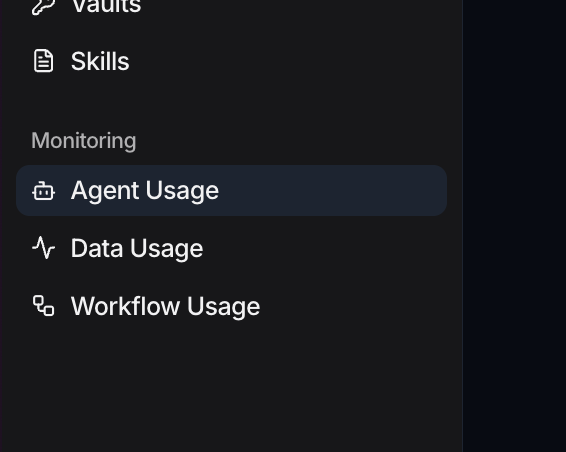
- In the left sidebar, open the Settings tab.
- Under Monitoring, select Agent Usage.
The page opens on Agent Usage with the subtitle Monitor agent consumption, tokens, tools, skills and models. Everything on it is scoped to the current workspace.
Set the time range
A row of time-range tabs at the top right drives every chart and table on the page: Last 7d, Last 30d, Last 90d, Last 6m, Last year, YTD, and All time. It opens on Last 30d. Trend badges elsewhere on the page compare the selected range against the previous period of the same length.
Agent consumption
The first section, Agent consumption, leads with three KPI cards:
- Agent calls: how many times your agents ran in the period, with a vs previous period trend.
- Raw tokens: the total input and output tokens your agents processed, also with a trend. An info tooltip explains exactly what the number counts.
- MTD calls: calls so far this month, shown against a progress bar reading of 1k / month. This is the one usage ceiling in the dashboard: a monthly limit of 1,000 agent calls.
Below the cards, an Agent calls chart plots Calls per day with a running MTD calls line and a dashed 1k / month limit line, and an Agent breakdown chart stacks the top agents by call volume (the rest are grouped as Other). A per-agent table then lists each agent with its Calls, Tool calls, Skill calls, and Raw tokens.
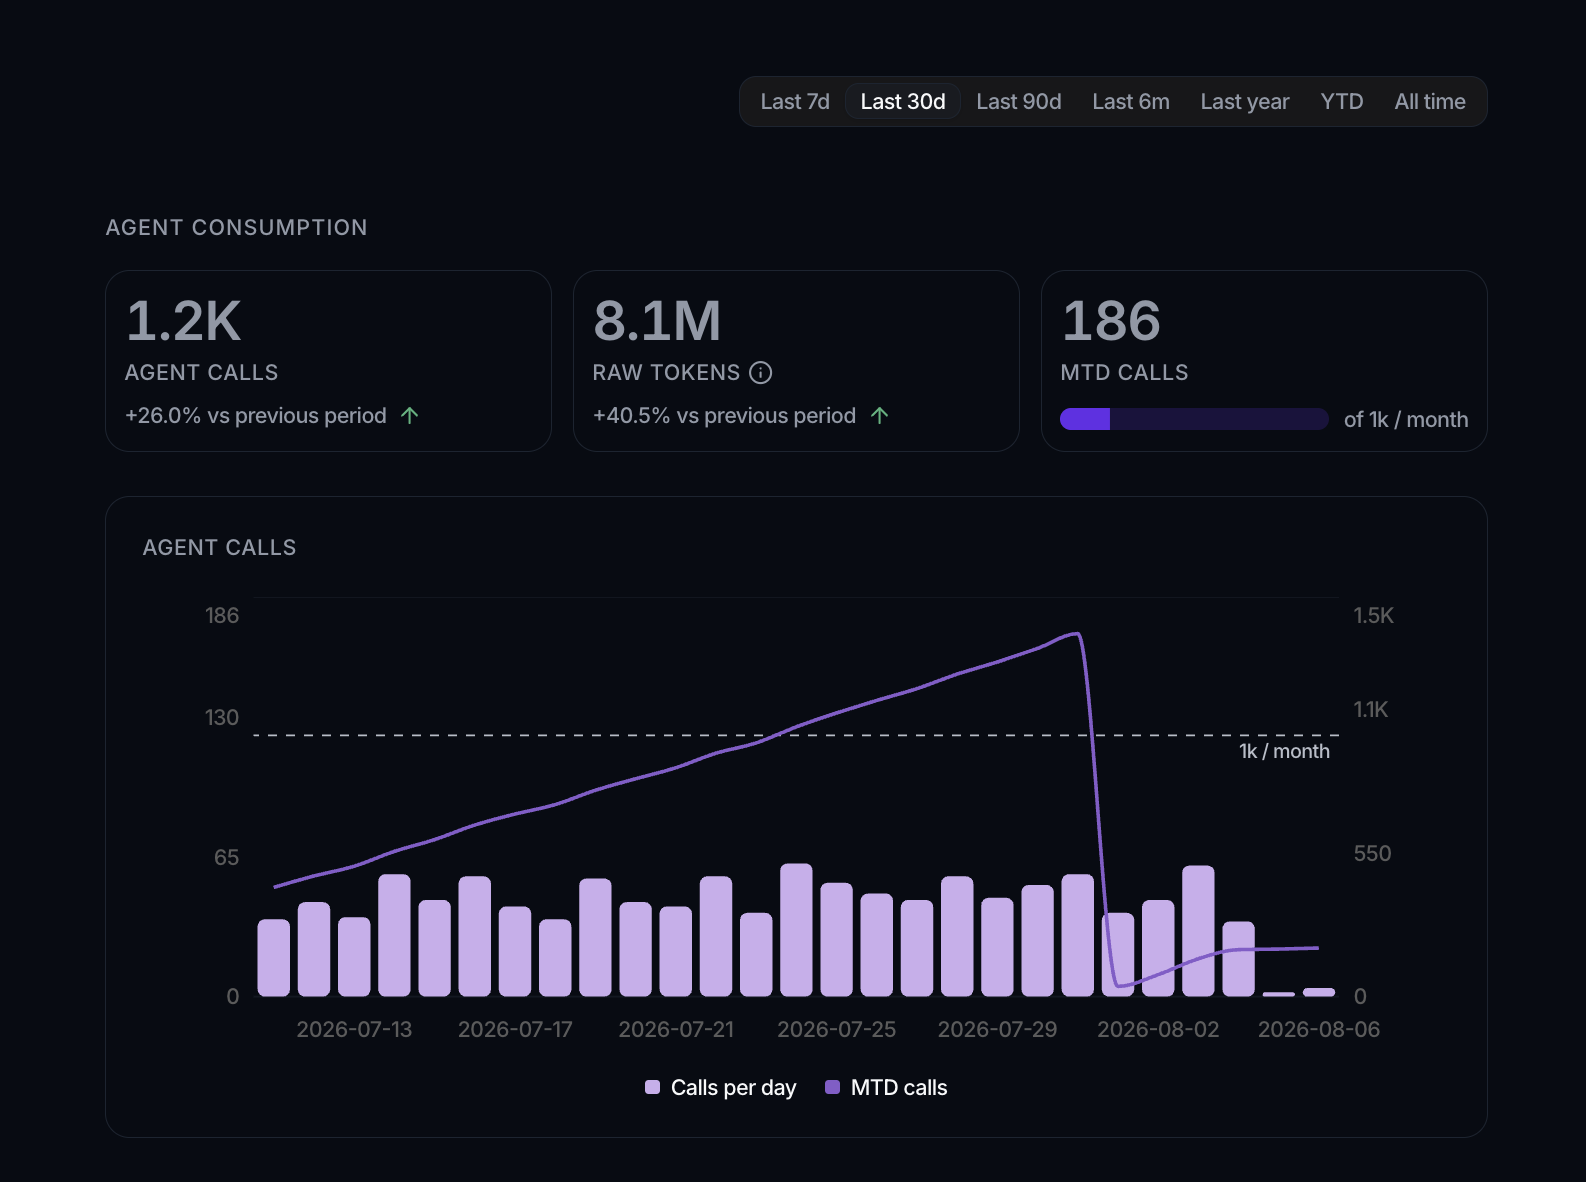
The only cap in this dashboard is the monthly limit on the number of calls (1,000 per month). Token counts are reported for insight but are not capped, and there is no cost or billing figure shown here.
Model breakdown
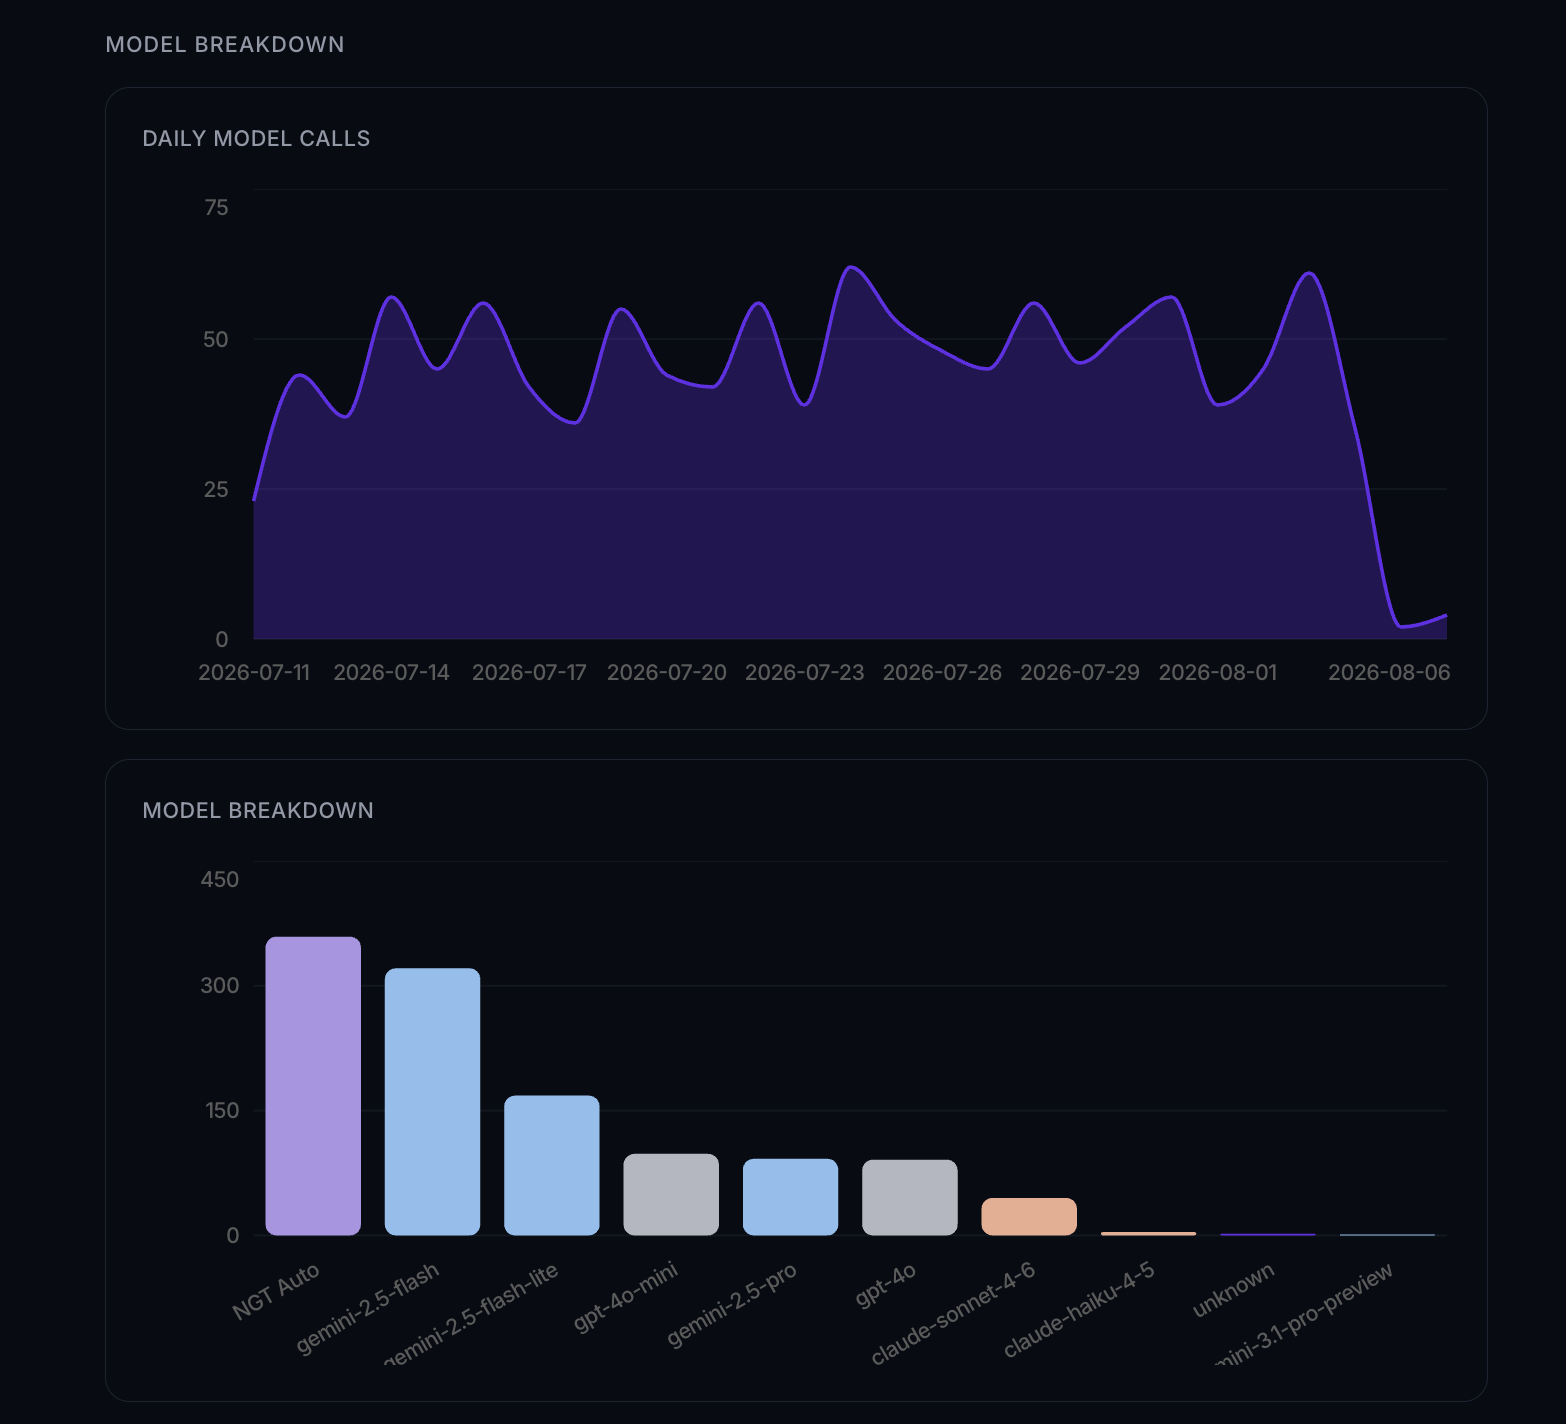
The Model breakdown section shows which models your agents used. A Daily model calls chart tracks usage over time, a Model breakdown chart compares models against each other, and a table lists each Model with its Tier, Calls, and Raw tokens. When an agent runs on automatic model selection, those calls are grouped together under NGT Auto rather than attributed to a specific underlying model.
Tools and skills
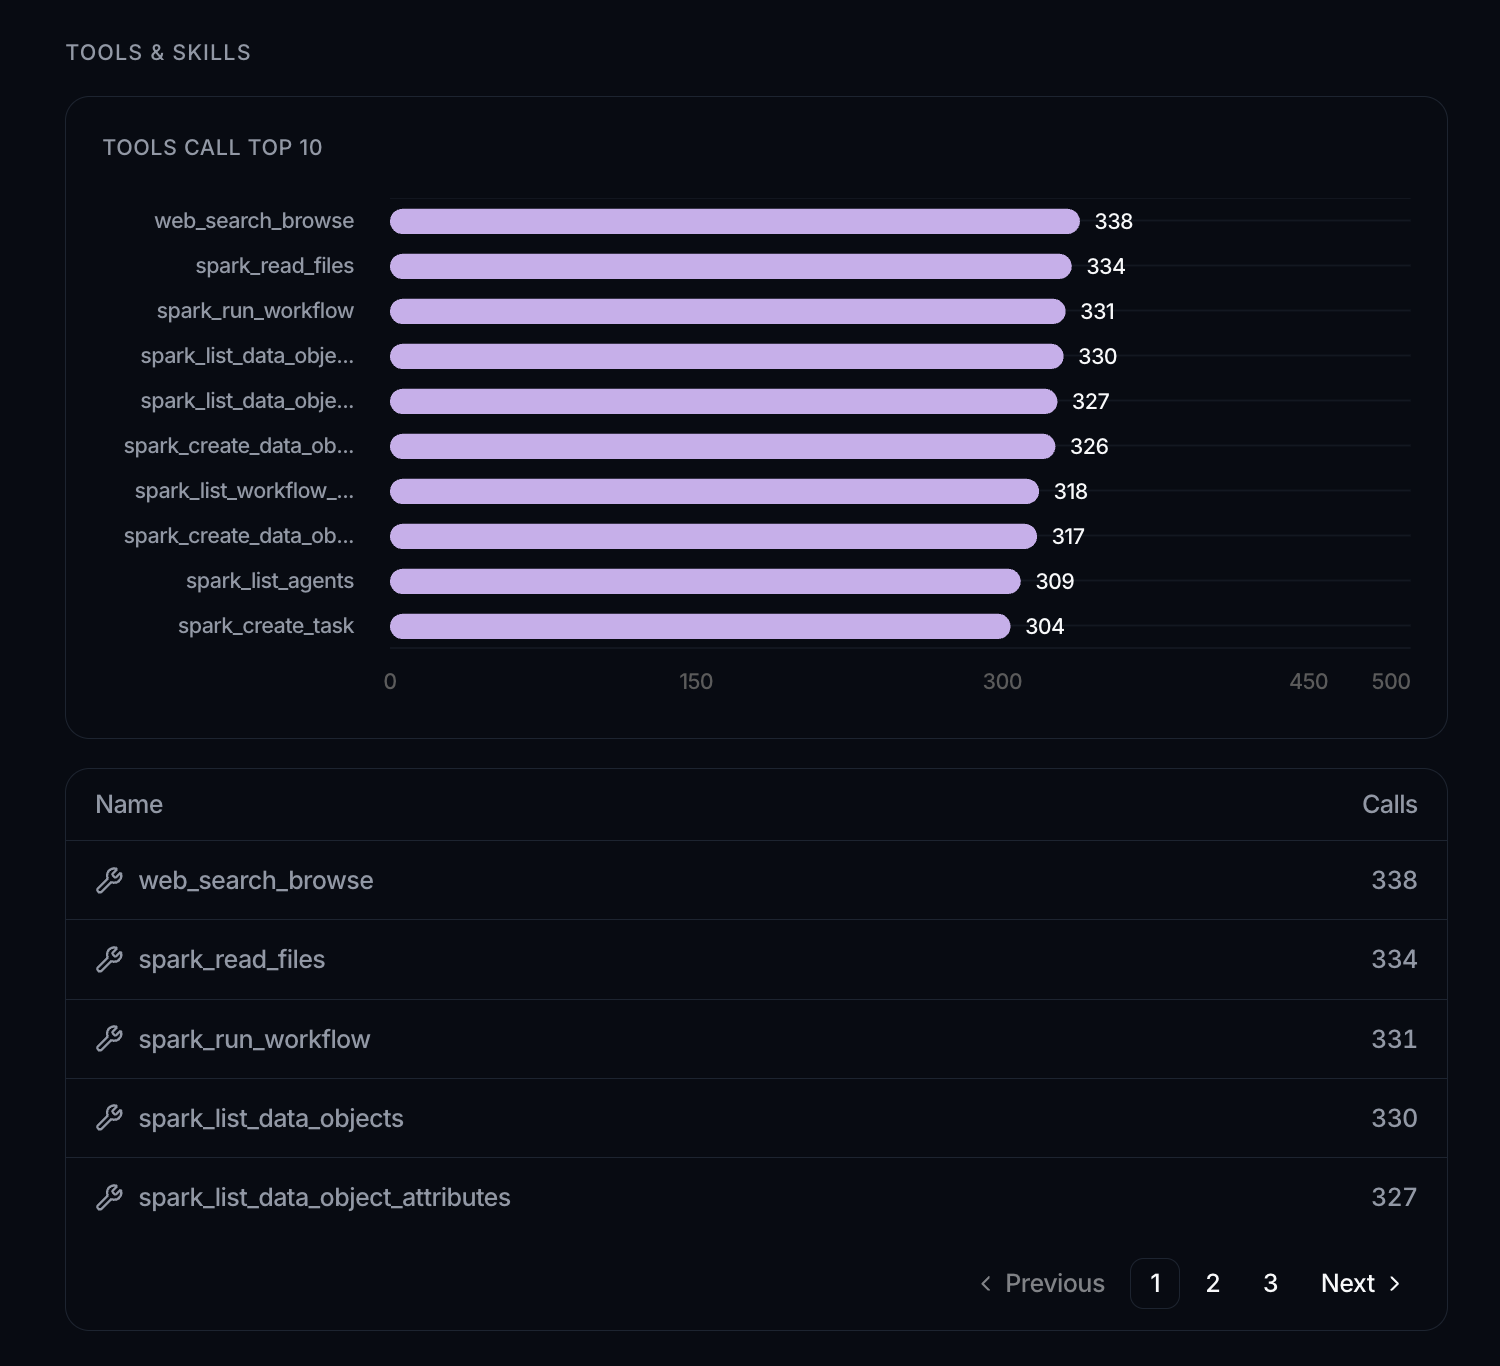
The Tools & skills section splits into two. A Tools Call Top 10 chart and table rank the tools your agents called most, and a Skill Calls Top 10 chart and table do the same for skills. Each table lists the Name and its number of Calls, so you can see which capabilities are actually being exercised.
Activity log
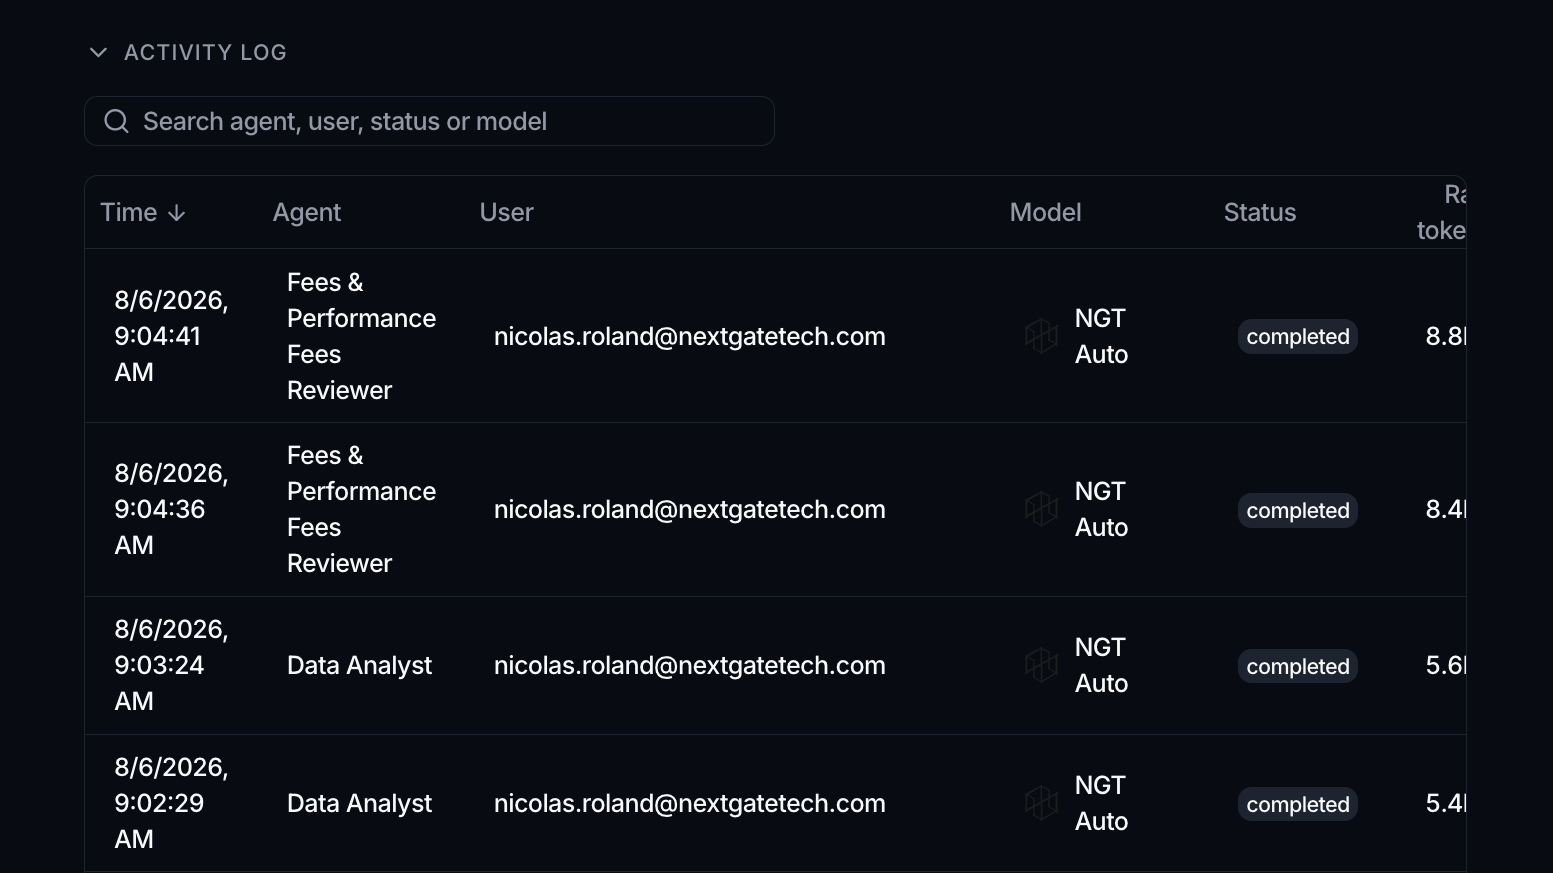
The Activity log at the bottom is a per-call record, collapsed by default. Expand it to browse individual agent calls, newest first. A search box (Search agent, user, status or model) filters the list, and a Load more button pages through older entries.
Each row is one agent call, with columns for Time, Agent, User (calls made by the system rather than a person show as System), Model, Status, and Raw tokens. Click a row to open Log details, which adds the model Tier, Prompt mode, a Chat link back to the conversation when there is one, the Input tokens and Output tokens breakdown, the Tool calls and Skill calls the call made, and its Duration.
The other Monitoring views
The same Monitoring area holds two more dashboards:
- Data Usage: totals and growth for records and storage across your data objects.
- Workflow Usage: workflow run counts, success and failure totals, and monthly limits.
Agents often act through your data and workflows, so these two views are a useful complement to Agent Usage.