Monitoring
Track agent, data and workflow usage against your plan.
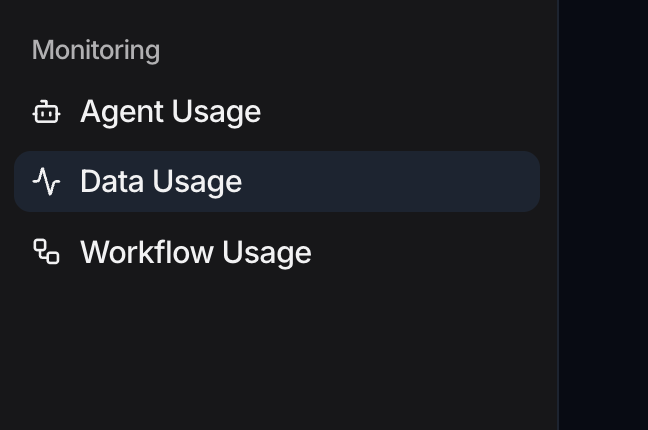
The Monitoring group in Settings tracks how much of the workspace's capacity you are using and how it is trending, across three dashboards: Agent Usage, Data Usage, and Workflow Usage.
Open a Monitoring page
- In the left sidebar, open Settings.
- Under the Monitoring group, choose Agent Usage, Data Usage, or Workflow Usage. They appear in that order.
Monitoring is a heading with no landing page of its own, so go straight to one of the three. Each dashboard is scoped to the current workspace and reads as a single scroll of sections, an Overview, Trends, a per-item breakdown, and a collapsible Snapshot History, rather than a set of tabs.
Agent Usage
Agent Usage (subtitle Monitor agent consumption, tokens, tools, skills and models) tracks how much your agents are being used and what they are doing. It covers agent consumption (calls, raw tokens, and month-to-date calls against a 1,000 / month limit), a model breakdown, the most-called tools and skills, and a per-call activity log. The same time-range tabs and trend badges apply here too.
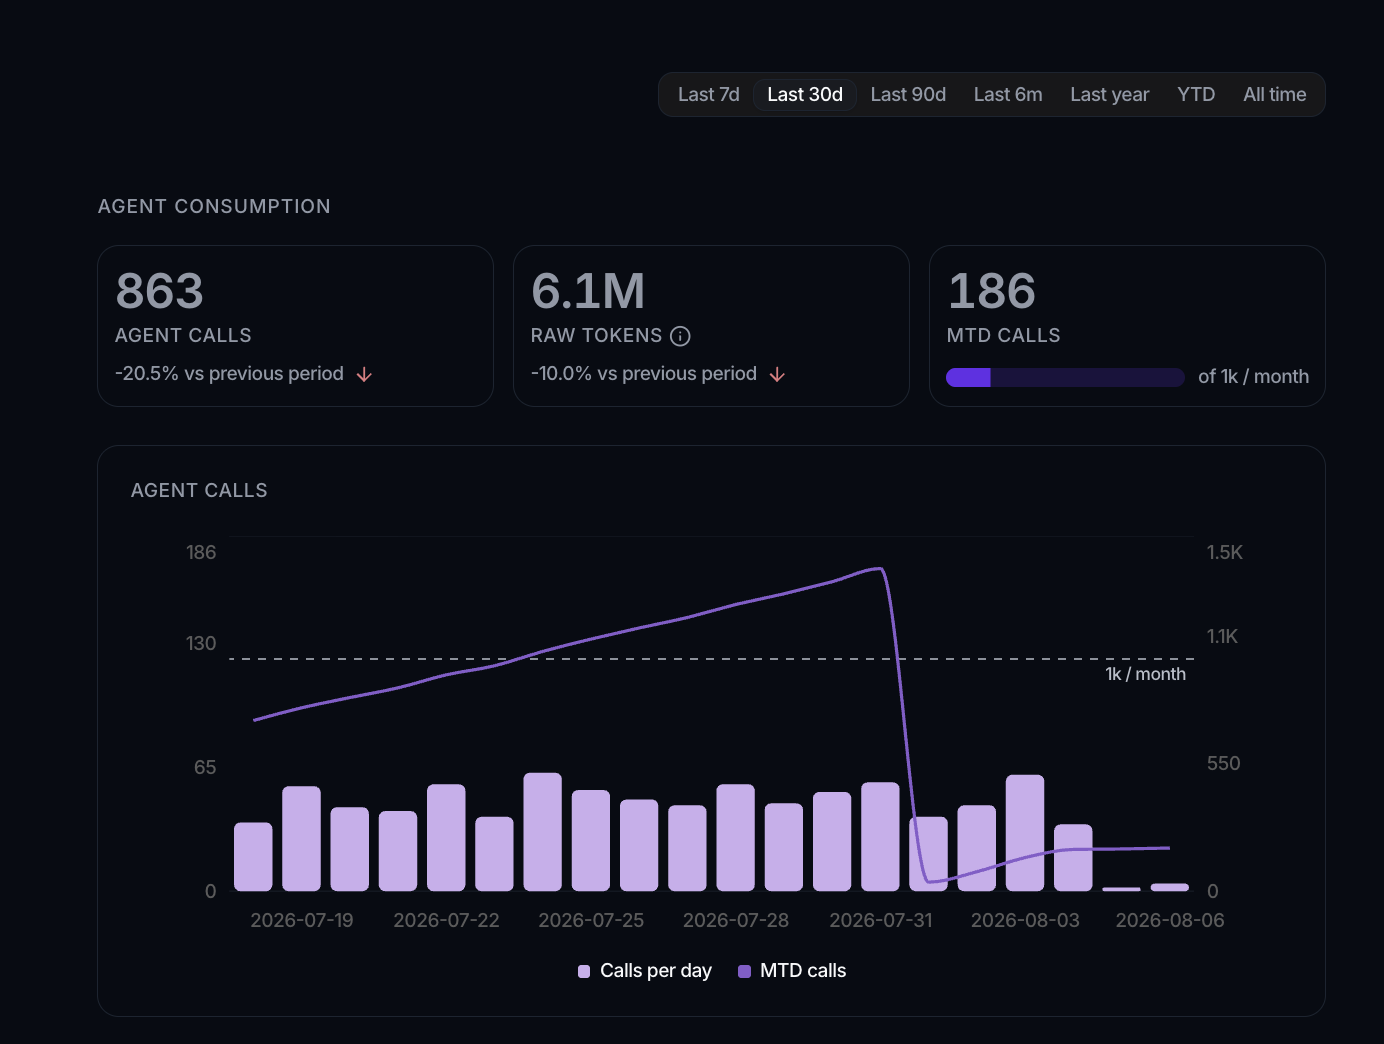
For the full walkthrough, with each card and chart, the model breakdown, and the searchable activity log, see Agent monitoring.
Data Usage
Data Usage (subtitle Monitor your workspace storage and data growth) tracks how much data the workspace holds and how fast it is growing. Its Overview cards cover Data Objects, Total Records, and Total Storage (against a 5 GB allowance); a Trends section charts record and storage growth from daily snapshots; and a Per Data Object breakdown drills into any single object. The same time-range tabs and Refresh control apply here too.
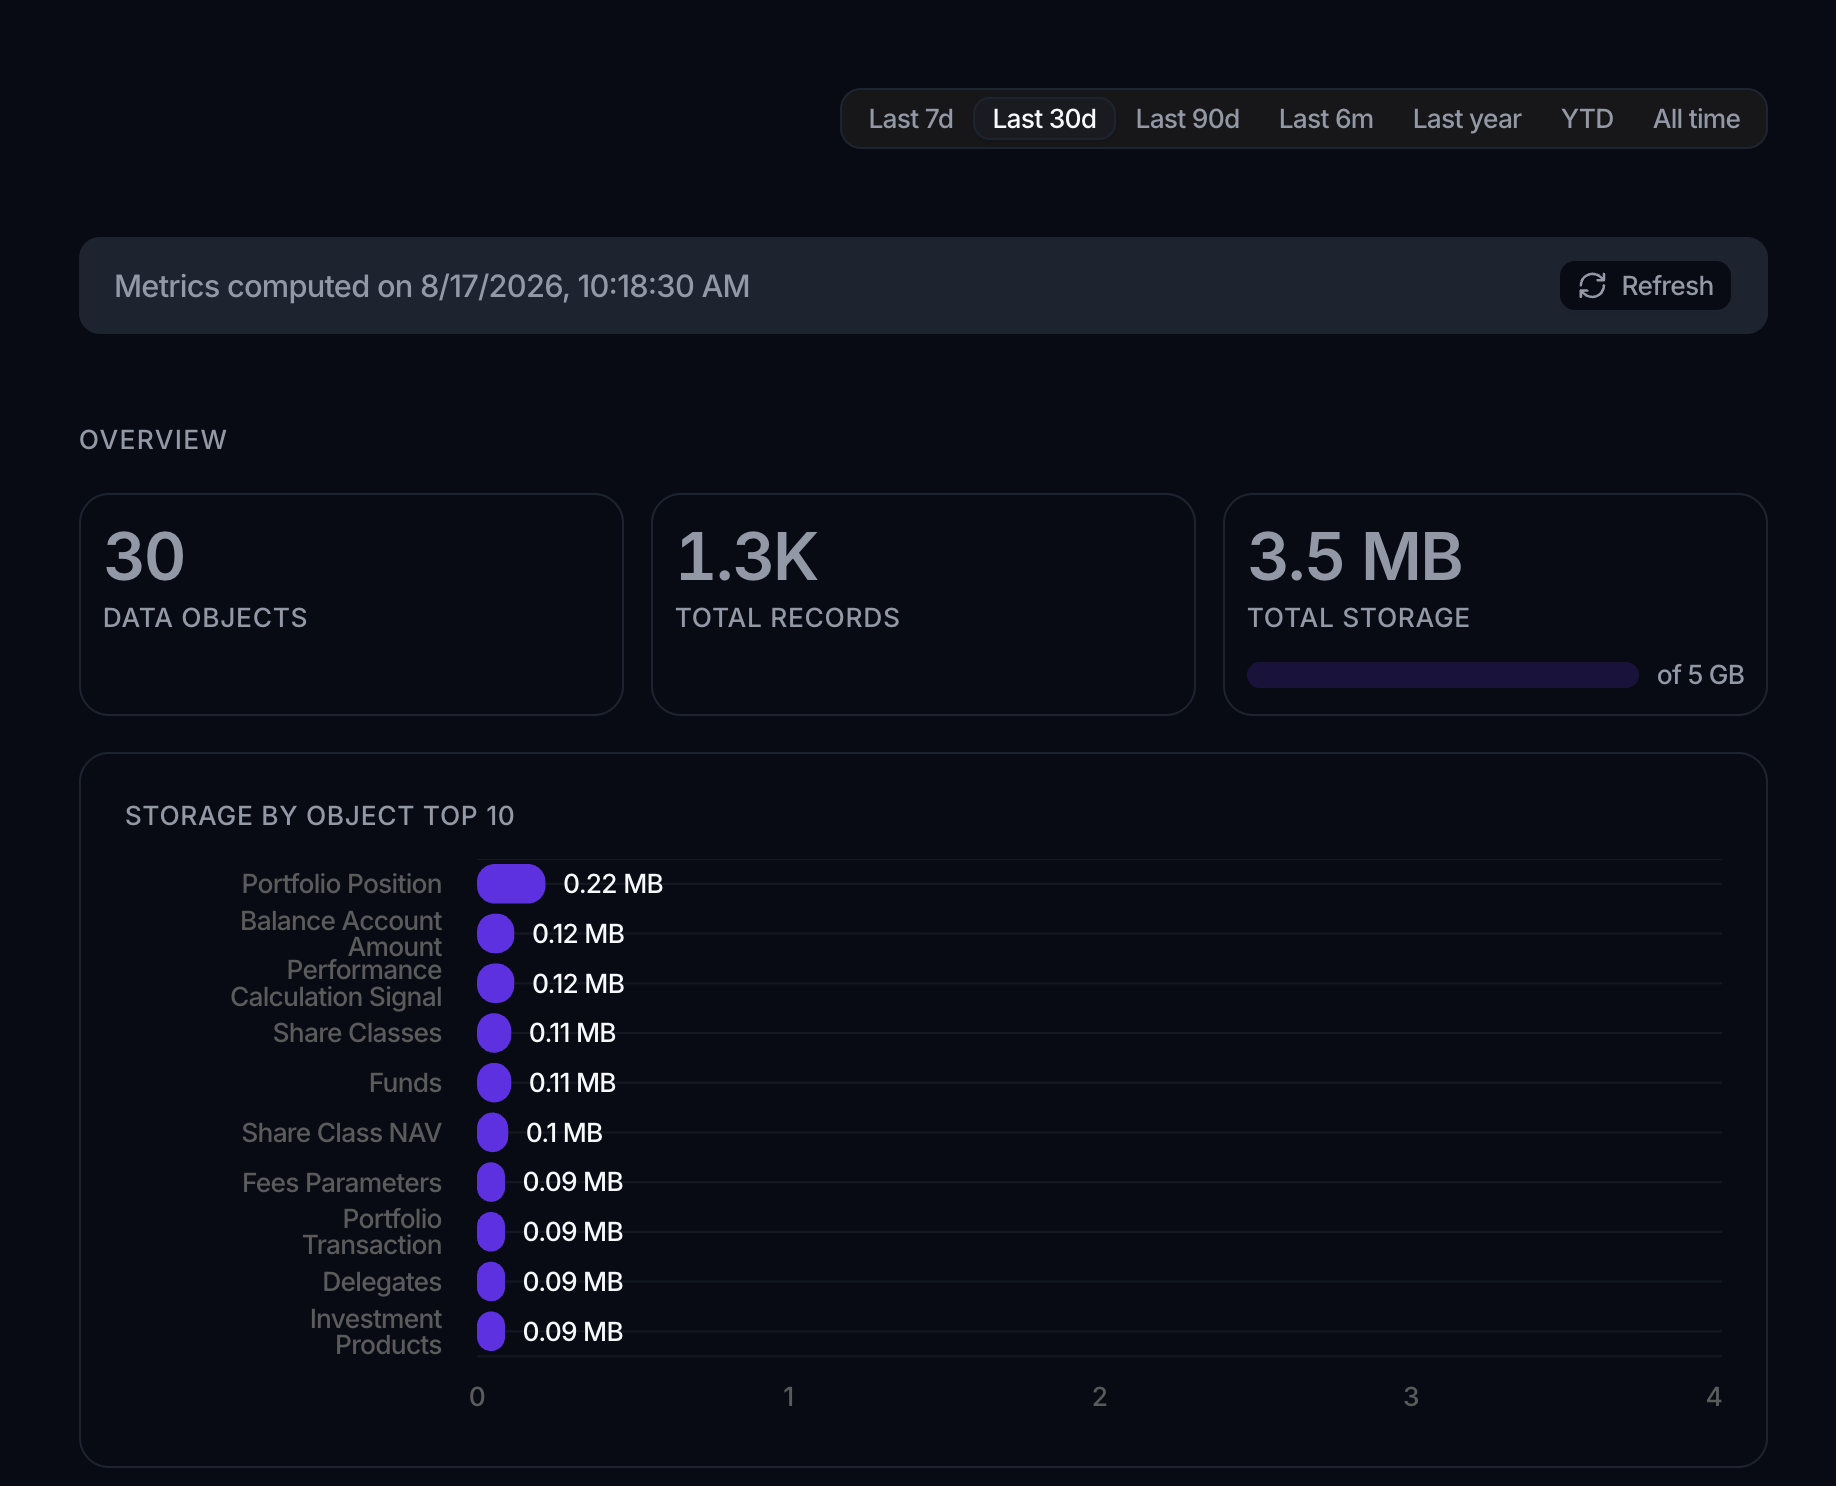
For the full walkthrough, with each card and chart, the Per Data Object drill-in, and the Snapshot History, see Data monitoring.
Workflow Usage
Workflow Usage (subtitle Monitor workflow execution metrics and trends) tracks how your workflows are running. It carries the same time-range tabs at the top right (Last 7d through All time, default Last 30d) to set the window for its trends.
Overview
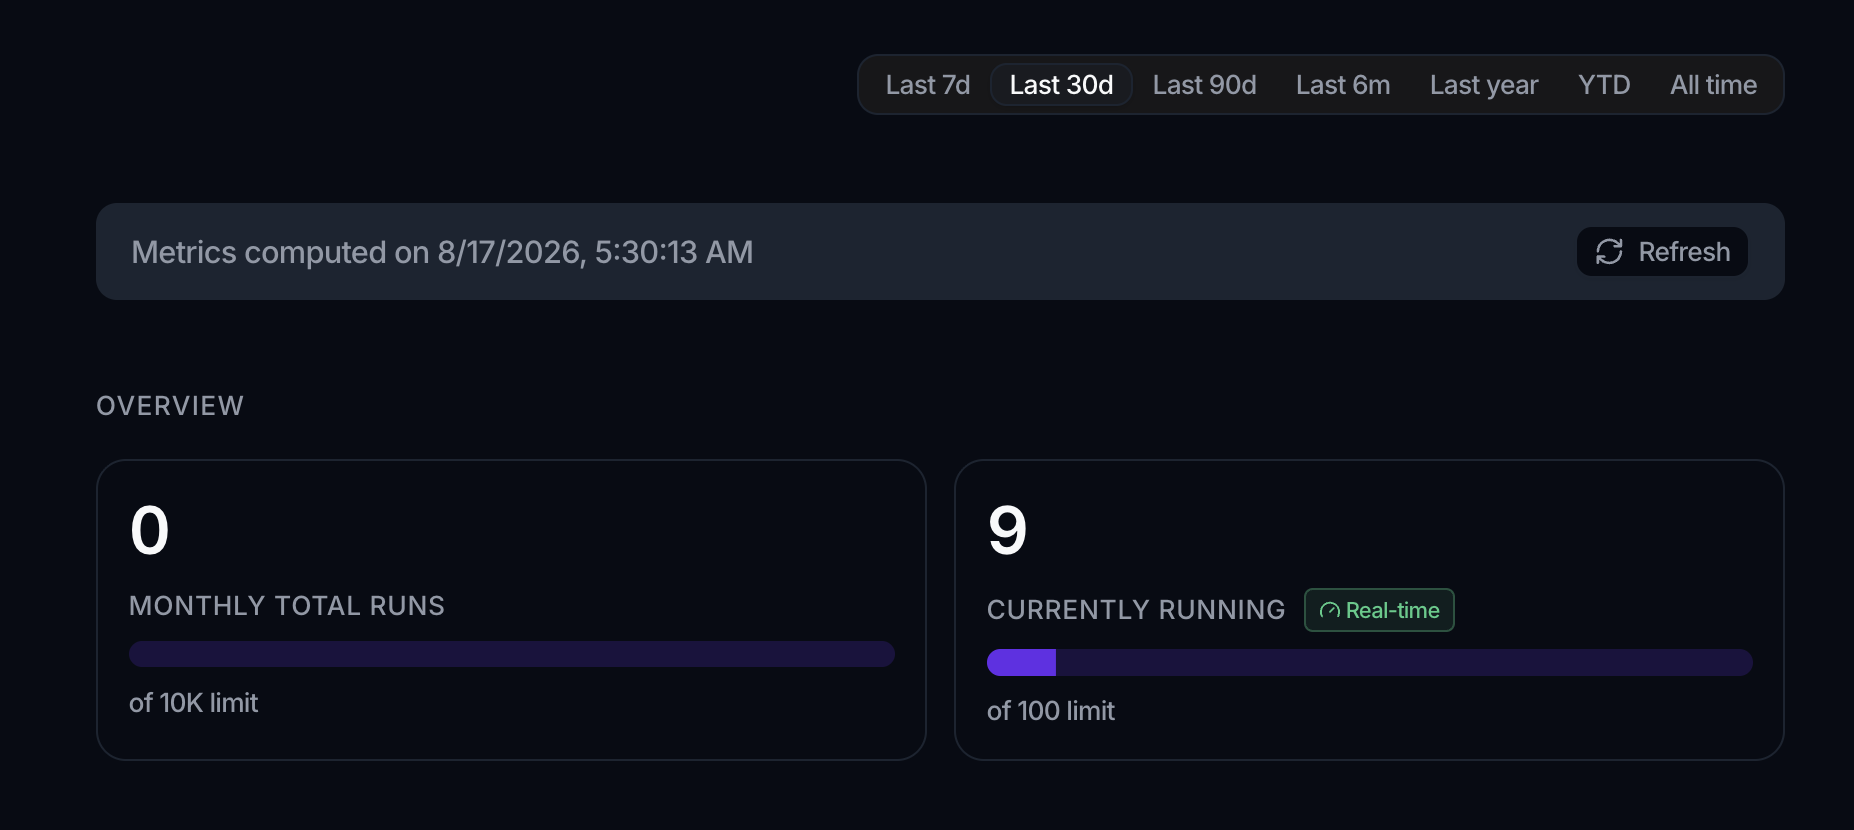
- Monthly Total Runs, the current month's runs on a progress bar against the limit of 10,000, with a trend versus the previous period.
- Currently Running, a live count marked Real-time, on a progress bar against the concurrency limit of 100.
- Active Definitions, the count of active workflow definitions, followed by their names.
A Cumulative Monthly Runs chart plots the running run total across the month.
Trends
Three cards, Succeeded, Failed, and Avg Duration, summarize the selected range, and an Execution Trend chart stacks succeeded (green) against failed (red) runs per period. As with data trends, the chart needs a couple of periods of history first; until then a note reads Trend data is not available yet. Data will appear once monthly execution history accumulates.
Per Workflow Definition
Choose one from the Select a workflow selector to see its own Total Runs (with its share of the period total), Currently Running, Succeeded, Failed, and Avg Duration, plus an Execution Trend chart for that definition.
Snapshots and history
Workflow metrics are generated on demand. On a workspace with no data yet, a Workflow Metrics panel offers Calculate Metrics to build the first snapshot; afterwards a Metrics computed on banner shows the last build with a Refresh button to regenerate it, subject to the same brief Too recent cooldown. The collapsible Snapshot History table lists snapshots by Snapshot Date and Computed At, and each row opens that snapshot's full view as a read-only page, with the live Currently Running figures omitted.
The 5 GB storage allowance, the 10,000 monthly runs, and the 100 concurrent runs are the ceilings shown in the dashboard today. The monthly run counter covers the current calendar month.
Where to go next
- The full Agent Usage walkthrough: Agent monitoring
- Configure the workspace: Workspace settings