Monitoring
Track how much data your workspace holds and how fast it is growing.
Data Usage is the dashboard for how much data the workspace holds and how quickly it is growing. It is one of the three dashboards in the Monitoring group under Settings (alongside Agent Usage and Workflow Usage), and this page walks through it in full. For the wider picture, see Monitoring in the administration section.
Open the Data Usage page
- In the left sidebar, open Settings.
- Under the Monitoring group, select Data Usage.
The page opens with the subtitle Monitor your workspace storage and data growth, and everything on it is scoped to the current workspace. It reads as a single scroll of sections, an Overview, Trends, a Per Data Object breakdown, and a Snapshot History, rather than a set of tabs.
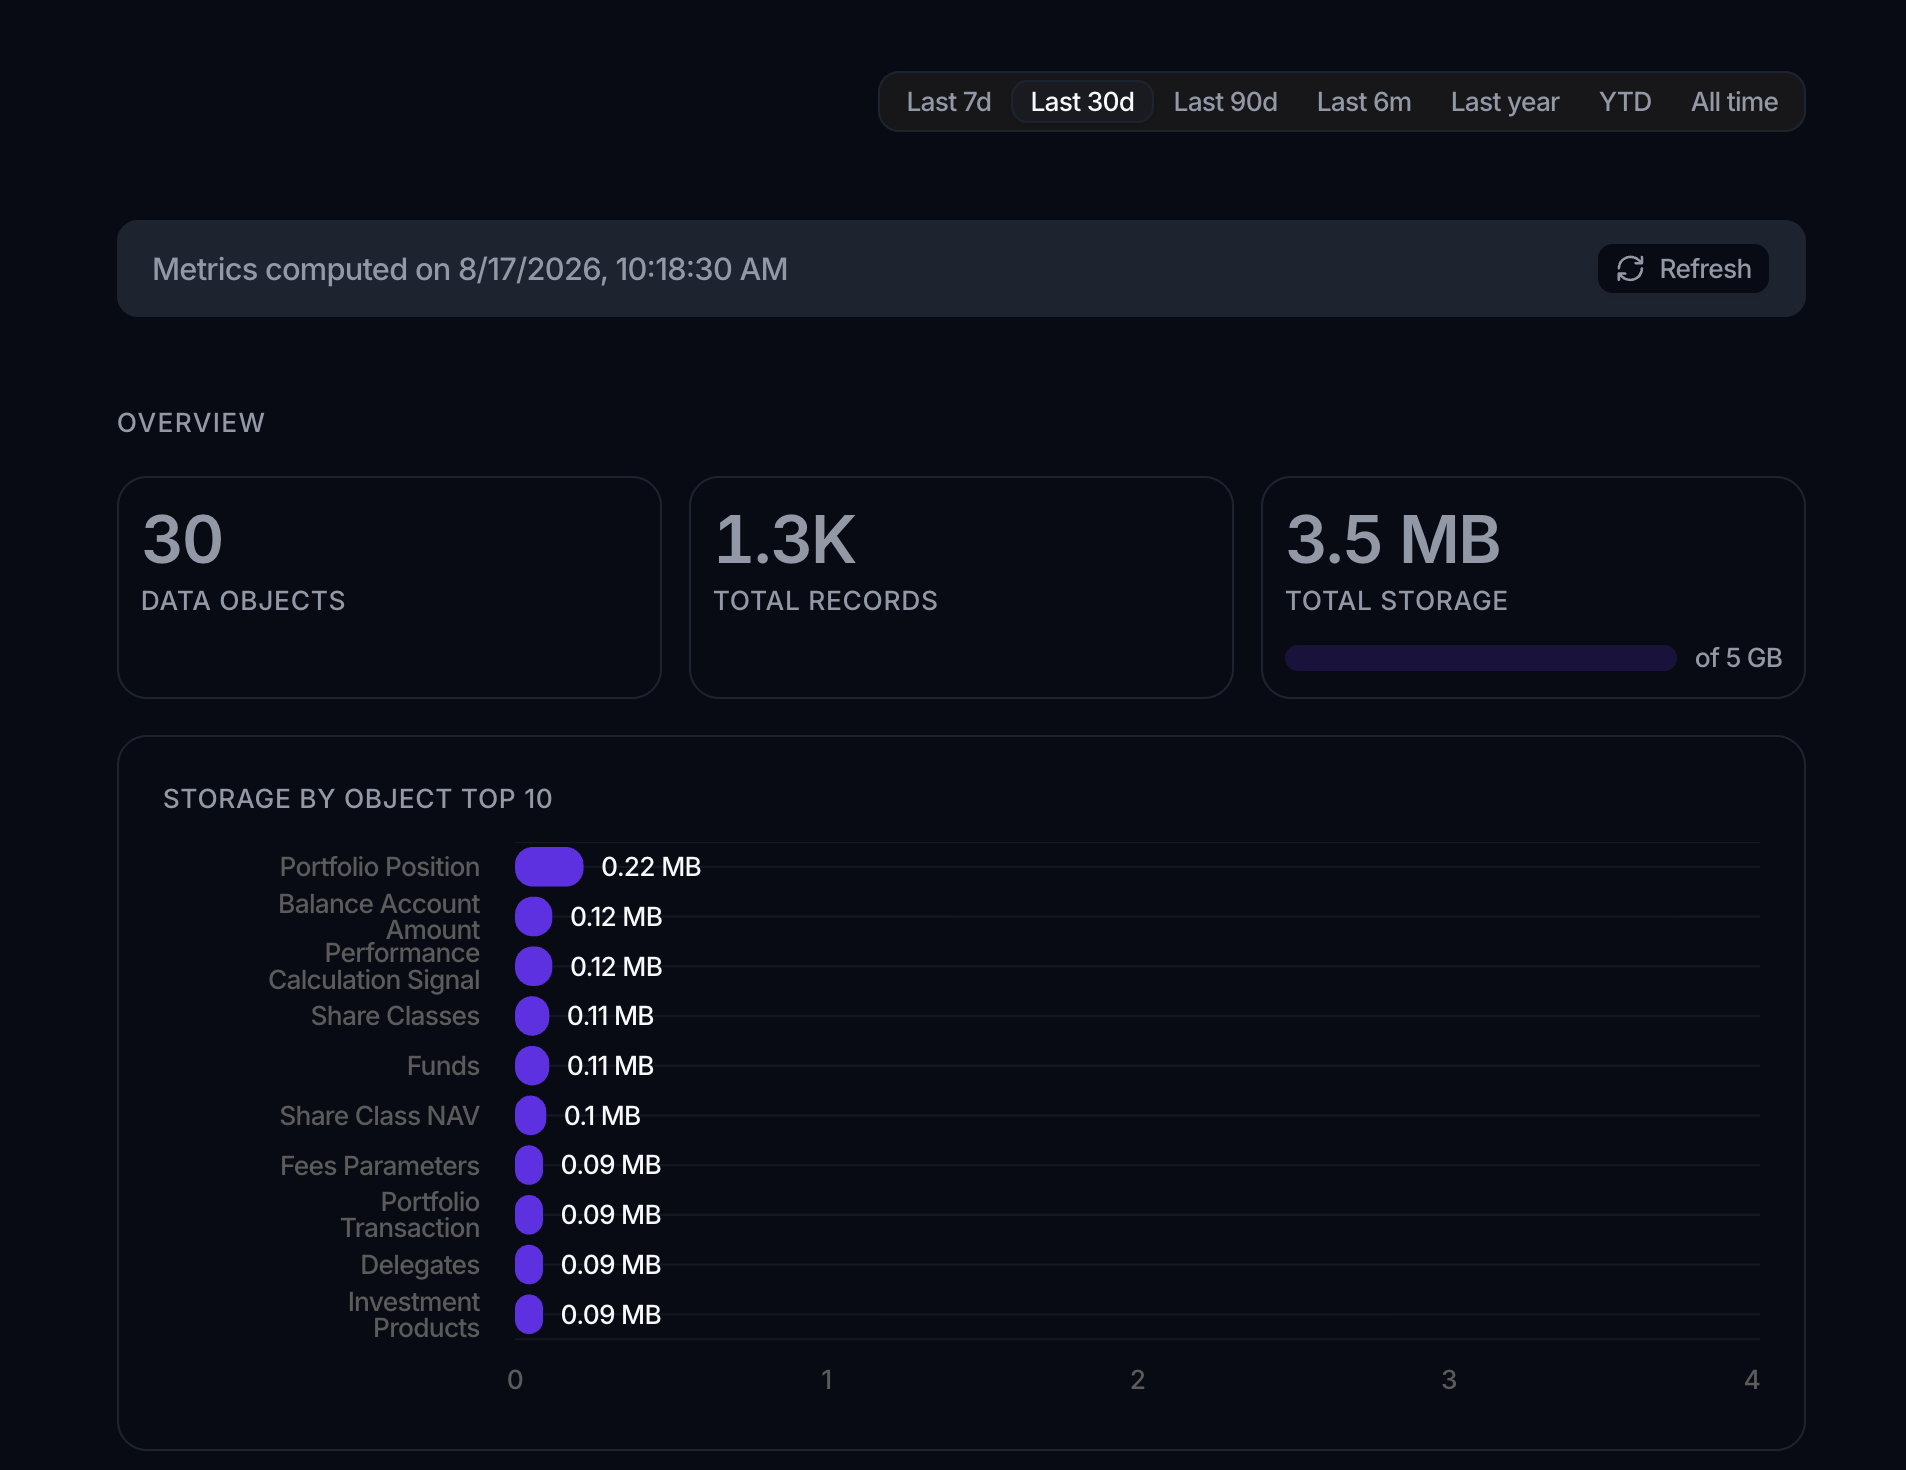
A time-range selector sits at the top right and sets the window for the trends and comparisons: Last 7d, Last 30d, Last 90d, Last 6m, Last year, YTD, and All time. It opens on Last 30d, and the trend badges compare that range against the previous period of the same length.
Overview
The Overview section leads with three KPI cards that summarize the whole workspace:
- Data Objects, the count of published objects.
- Total Records, the total record count across every object.
- Total Storage, shown on a progress bar against the plan allowance of 5 GB.
When the workspace holds more than one custom object, two ranking charts follow, so you can see where the weight sits:
- Storage by Object Top 10, the objects using the most storage.
- Records by Object Top 10, the objects with the most records.
Trends
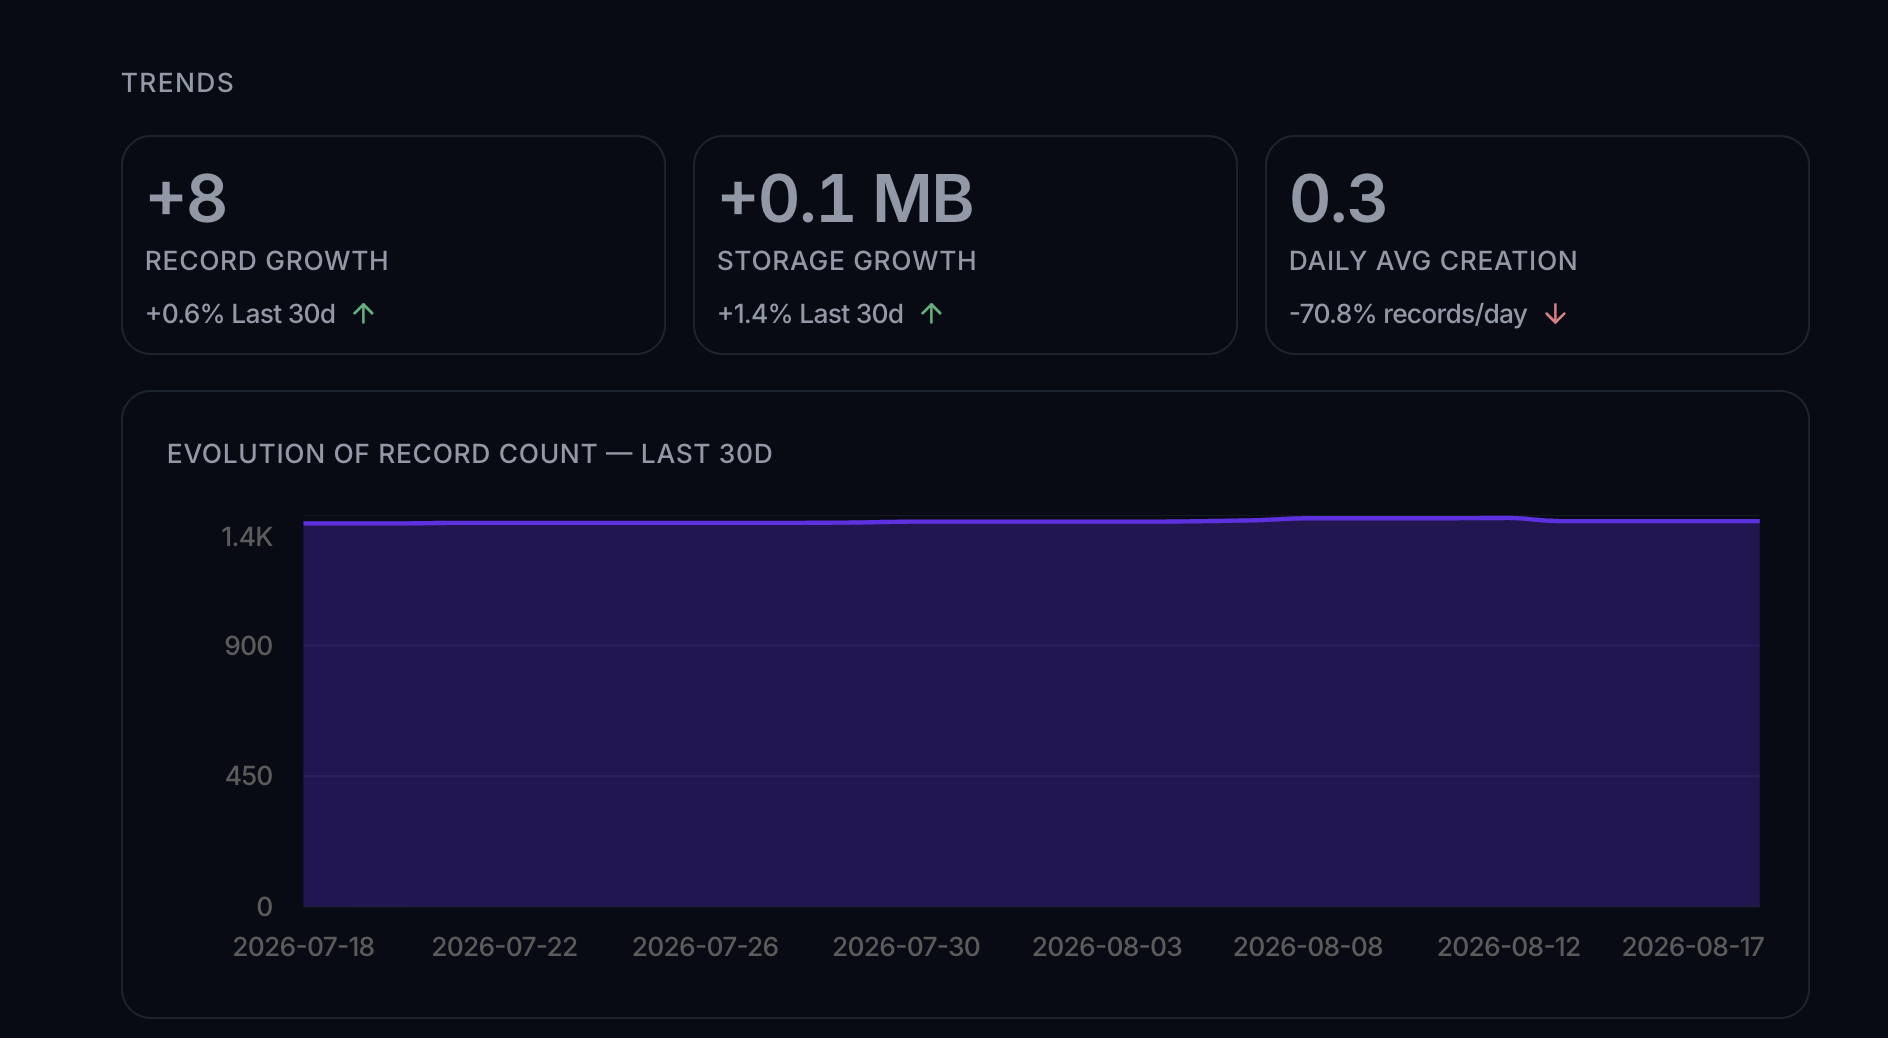
The Trends section shows how the workspace is growing over the selected range. It opens with three growth cards:
- Record Growth, the net records added (for example
+1,200). - Storage Growth, the storage added (for example
+0.3 GB). - Daily Avg Creation, the recent pace of new records per day.
Two area charts then plot the totals over time: Evolution of record count and Evolution of storage space.
Trends lean on daily snapshots, so the charts only appear once enough history has built up (about 5 days' worth). Until then the section reads Growth trends are not available yet. Data will appear once daily snapshots start accumulating, and while the history is still short a note points out that more detailed insights become available after a few days of tracking.
Per Data Object
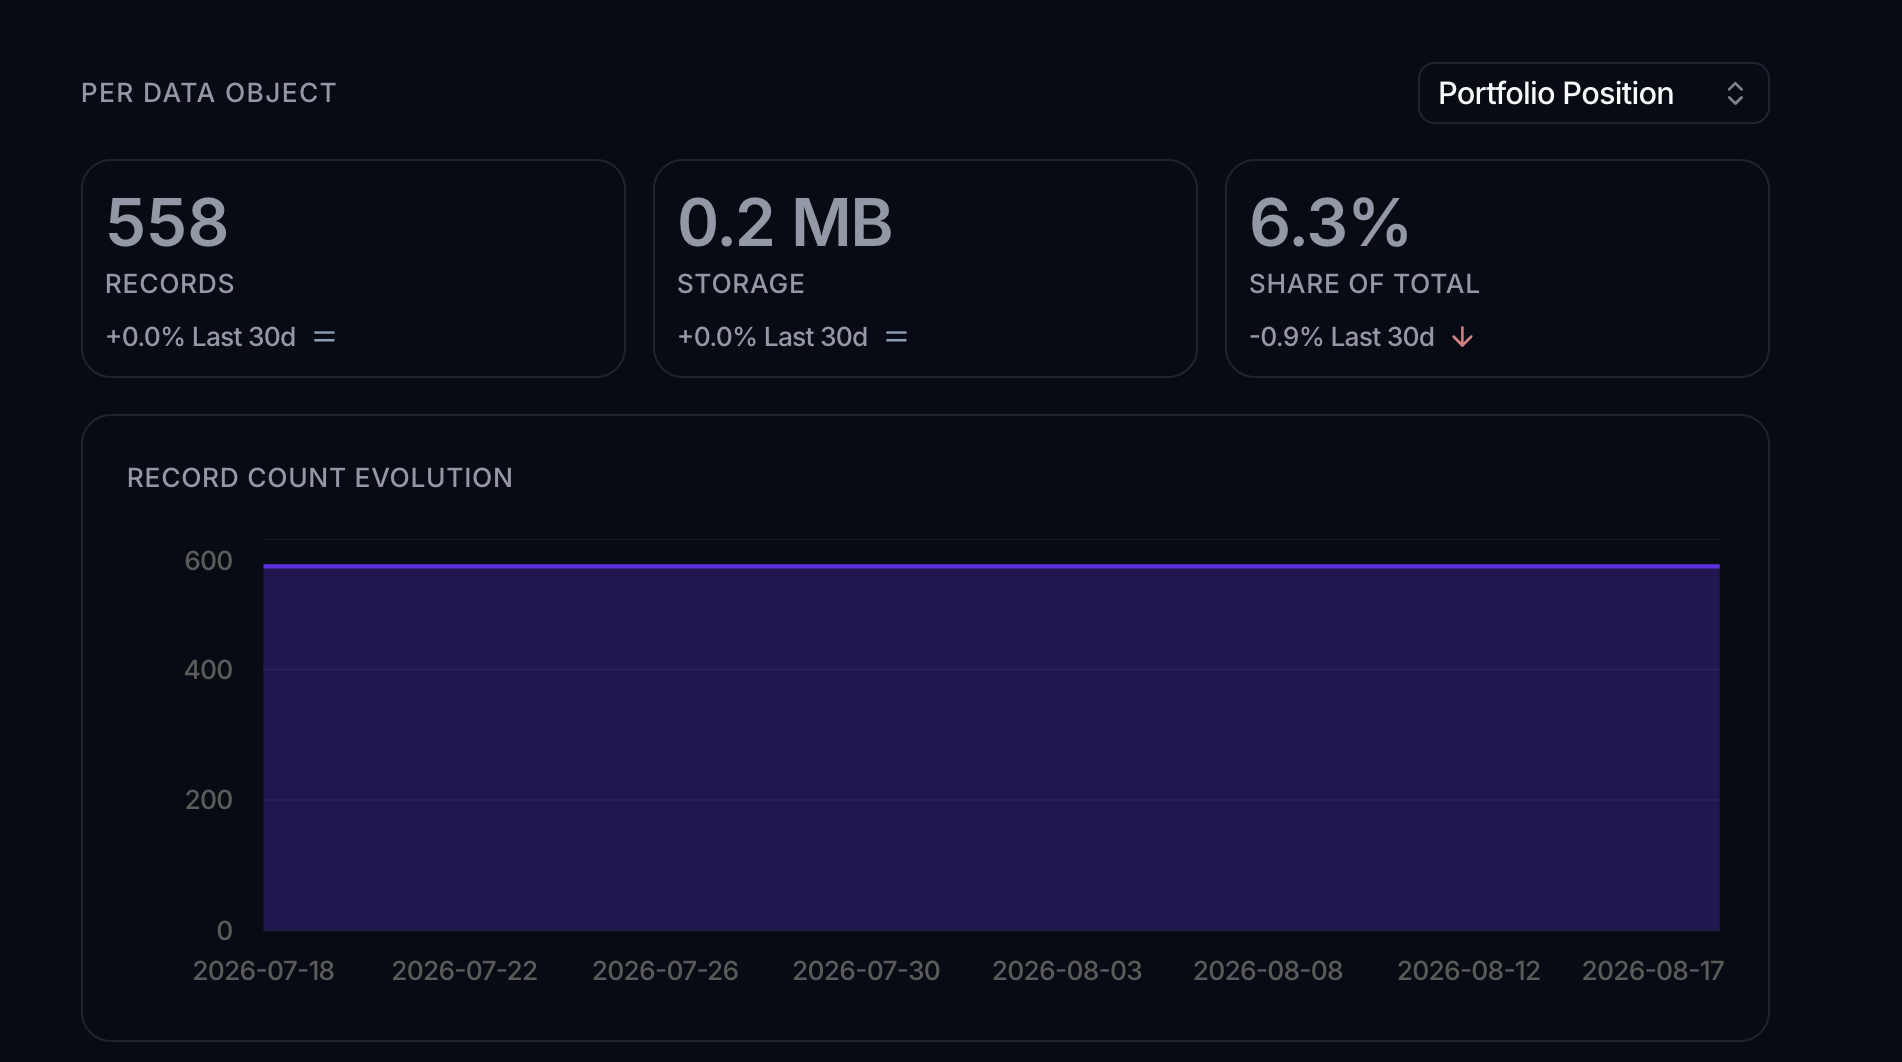
The Per Data Object section drills into a single object. Pick one from the Select a data object selector, and its cards show:
- Records, that object's record count, with a trend.
- Storage, that object's storage, with a trend.
- Share of Total, its slice of total workspace storage, with a trend.
Once enough snapshots exist, the section also draws record-count and storage evolution charts for just that object, so you can watch one object's growth in isolation.
Snapshots and history
Data Usage snapshots are captured automatically as the days pass, so the trends fill in on their own. A banner reads Metrics computed on the latest snapshot's date, with a Refresh button to recompute the current figures on demand; Refresh has a 5-minute cooldown and reads Too recent if you just used it.
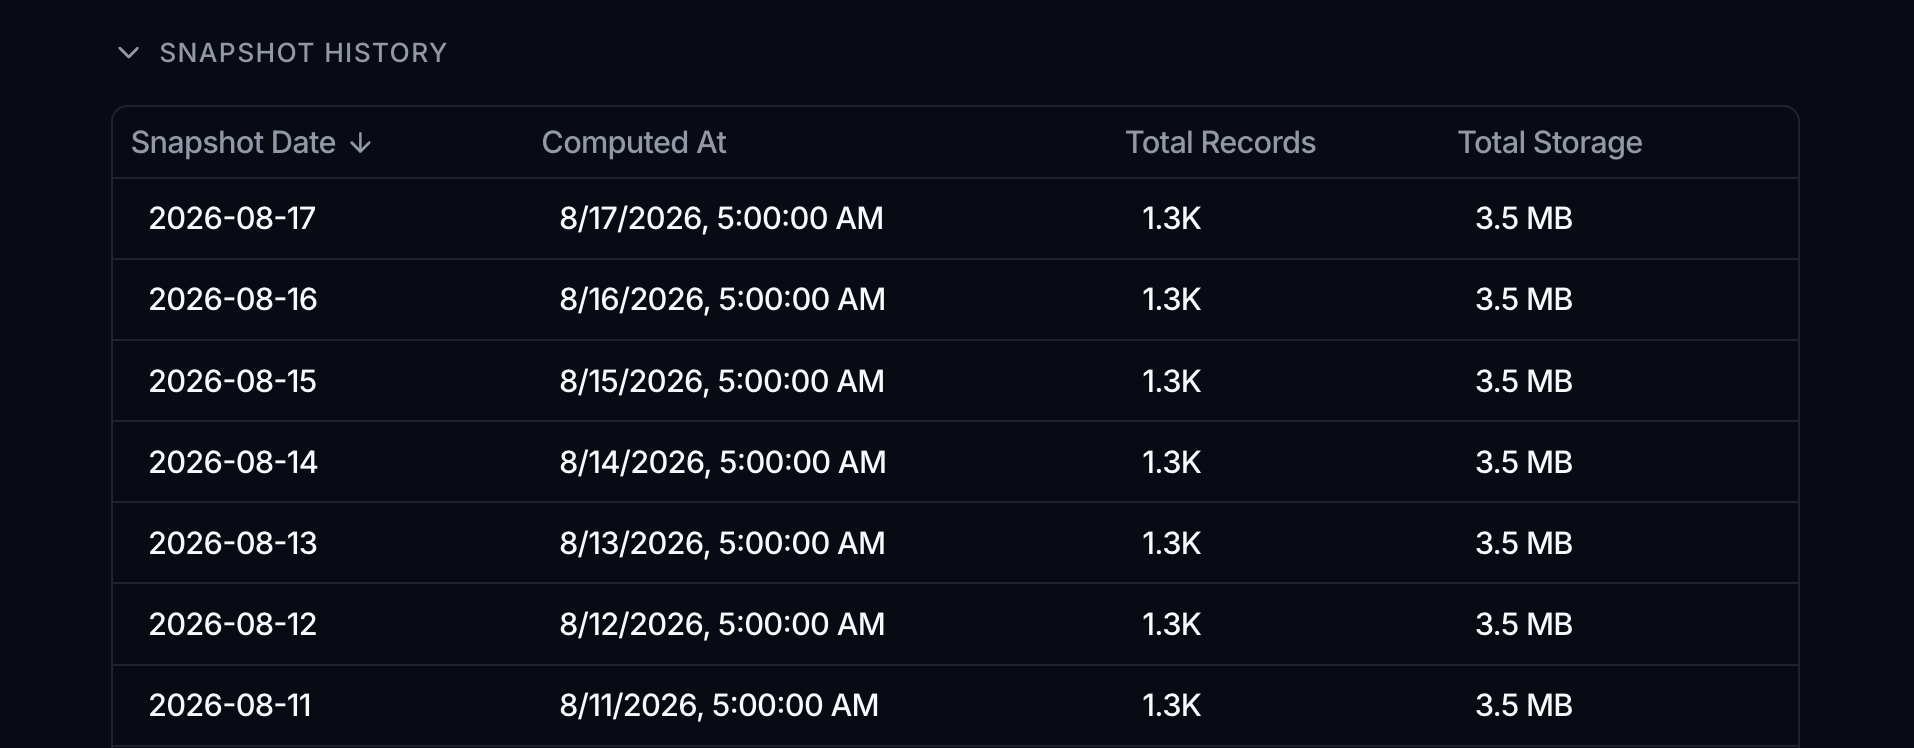
At the bottom, a collapsible Snapshot History table lists past captures, with columns for Snapshot Date, Computed At, Total Records, and Total Storage. Use Load more to page through older entries, and click any row to open that day's full snapshot as a read-only view of the whole dashboard as it stood then.
The 5 GB storage figure is the allowance shown in the dashboard today. The count and storage totals reflect active records; archived and deleted data are handled separately, so a delete that detaches related records lowers the totals accordingly.
Where to go next
- The other Monitoring dashboards: Monitoring
- Add and manage the data these numbers count: Add, edit & import records
- Shape how records display: Manage data views